


 |
|---|


| PAGE: 110 | SET: Exercises | PROBLEM: 46 |

![]()
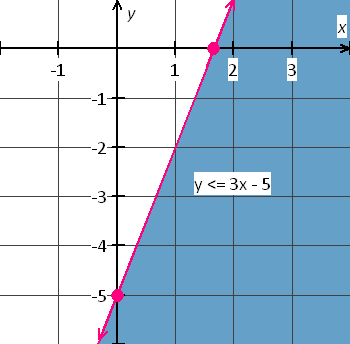
The graph of the inequality  is the shaded region and boundary of the inequality is
 . To graph the boundary, find the x-intercept and y-intercept of the line.
First find the y-intercept.
The y-intercept is the value of y, when  .
.
 (Substitute
  )
)
 (Multiply:
  )
)
 (Apply Additive identity property:
  )
)
The y-intercept is – 5, so the graph intersects the y-axis at (0, – 5).![]()
Next find the x-intercept.
The x-intercept is the value of x, when  .
.
 (Substitute
  )
)
 (Add 5 to each side)
 (Simplify)
 (Divide each side by 3)
 (Cancel common terms)
 (Divide:
  )
)
The x-intercept is 1.66, so the graph intersects the x-axis at (1.66, 0).![]()
To draw inequality follow the steps.
1. Draw a coordinate plane.
2. Plot the points.
3. Since inequality symbol is  , the boundary is included in the solution set. Graph the boundary of the inequality with a solid line.
4. To determine which half-plane to be shaded use a test point in either half-plane. A simple choice is (0, 0).
Substitute and y = 0 in original inequality .

The statement is false.
4. Since the statement is false, shade the region that do not contains point (0, 0).
![]()
Inequality graph is

|
"I want to tell you that our students did well on the math exam and showed a marked improvement that, in my estimation, reflected the professional development the faculty received from you. THANK YOU!!!" June Barnett |
|
"Your site is amazing! It helped me get through Algebra." Charles |
|
"My daughter uses it to supplement her Algebra 1 school work. She finds it very helpful." Dan Pease |
Simply chose a support option

|