


 |
|---|
SELECT PAGE NO.
No Books/Pages Are Available |
SELECT PROBLEM NO. FOR THE PAGE |


| PAGE: 117 | SET: Exercises | PROBLEM: 107 |


The stopping distance of the car moving with a speed  is equal to distance traveled by the car during reaction time
  plus distance traveled by the car after applying brakes
  .
.
(a)
Calculate linear model of reaction time distance.
Observe the table.
Excel sheet method is used to find the linear regression equation.
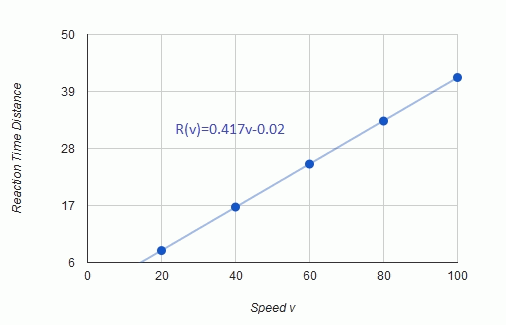
Observe the graph:
The linear regression model of the data for reaction time distance is  .
.

(b)
Calculate quadratic model of Braking time distance.
Observe the table.
Excel sheet method is used to find the quadratic regression equation.
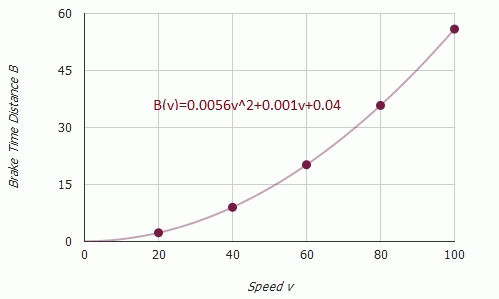
Observe the graph:
The quadratic regression model of the data for braking time distance is  .
.

(c)
The total stopping distance is equal to reaction time distance plus braking time reaction .

Stopping distance of the car  .
.

(d)
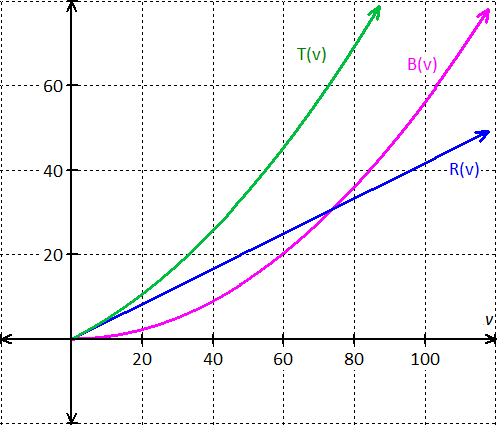
Graph:
Draw the coordinate plane.
Plot the Reaction time distance function  .
.
Plot the Braking time distance function  .
.
Plot the Stopping time distance function  .
.

(e)
Find the derivative of  .
.
The Stopping time distance function .
Apply derivative on each side with respect to .

(i)
Find the rate of change of total stopping time at  .
.
Substitute  in the derivative of the total stopping distance.
 .
.
Rate of change of total stopping time at is  .
.
(ii)
Find the rate of change of total stopping time at  .
.
Substitute  in the derivative of the total stopping distance.
 .
.
Rate of change of total stopping time at is  .
.
(iii)
Find the rate of change of total stopping time at  .
.
Substitute  in the derivative of the total stopping distance.
 .
.
Rate of change of total stopping time at is  .
.
![]()
(f)
Observe the results obtained in (e).
Rate of change of total stopping time at is  .
.
Rate of change of total stopping time at is  .
.
Rate of change of total stopping time at is  .
.
As speed increases, the rate of change in total stopping time increases.
![]()
(a) The linear regression model for reaction time distance is .
(b) The quadratic regression model for braking time distance is .
(c) Graph of the , and  is
is
(d)
Rate of change of total stopping time at is .
Rate of change of total stopping time at is .
Rate of change of total stopping time at is .
(f) As speed increases, the rate of change in total stopping time increases.

|
"I want to tell you that our students did well on the math exam and showed a marked improvement that, in my estimation, reflected the professional development the faculty received from you. THANK YOU!!!" June Barnett |
|
"Your site is amazing! It helped me get through Algebra." Charles |
|
"My daughter uses it to supplement her Algebra 1 school work. She finds it very helpful." Dan Pease |
Simply chose a support option

|